
I am happy to begin my relationship with Thoroughbred Analytics.
I am best known to horseracing fans as the creator of Sh*t Horseplayers Say. Here’s the originalvideo: http://www.youtube.com/watch?v=Ks_1wwaG2CM
As an avid and obsessive fan of horse racing, I certainly have my opinions, but this blog is not primarily about giving out winners. (Thoroughbred Analytics has a proprietary computer model designed to do a better, more comprehensive job of that.) Still, I realize that horseplayers like to view a racecard as a series of puzzles to be solved. No matter how much objective data we are presented, we want the satisfaction of making our own decisions about how that data will play out during the race. Each race is individual, and while the parameters of a computer model can help narrow down the field, your individual observations may make the difference. I see my role here more as offering perspectives on approaching the puzzles, rather than telling you where to place the pieces.
As handicappers, we have all likely been exposed to various “angles” for picking winners. But just because you’re aware of an angle, doesn’t mean you’ll remember it when it’s applicable. Sometimes the forest overwhelms the specific trees, and it’s easy to overlook an obvious indicator staring us right in the face. I hope this blog helps to keep these considerations alive in your mind, to apply when you need them.
Also, due to the breadth of Thoroughbred Analytics’ information, it is important to consider approaches that can be applied not only to the major tracks, but also to your home track. So, while I may give examples from high profile races, they can usually offer insight no matter where you are playing.
Happy racing,
Steve Brady

The Eyes Have It
Horseplayers are always searching for a horse who is either a vulnerable favorite to toss out, or one who is going to exceed the betting public’s expectations. I mean, where’s the fun in going with the crowd?
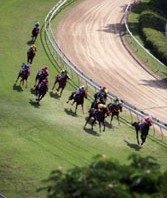
There are a few ways to do that: You can trust the public handicappers (ha!!!); you can interpret the trip notes on the right side of the past performances; you can watch the tote board and try to “follow the money;” you can hope the morning workouts give you a clue to his next performance, or hope that the horse’s breeding will kick in just in time for you to score. While there’s a place for all of those approaches, any one of them is enhanced by watching video (race chart in hand) and making notes of horses to watch, and adding them to your stable.
The Kentucky Derby is less than a month away, and it provides an excellent opportunity to try to find under-the-radar contenders, either to win at a price, or to fill in your Derby vertical bets (exactas, tris, supers, or super hi-5s) even if a favorite does win. Hansen, Union Rags, and Creative Cause were the top three in the Breeders’ Cup Juvenile in November, and all three have maintained their positions at the top of this year’s crop. Still, it is unlikely that they will all hit the board on May 5th at Churchill Downs. BC Juve winners have a notoriously poor record in the Derby, and it’s actually surprising they’ve stuck around this long. Let’s see if we can go deeper into the field.
Although you can discern a certain amount of information about the pace by looking at the fractional times, they can often be deceptive. I think you can get a better gauge on how the race was run by actually watching it and seeing how the speed and closers did against each other. There is also a lot to be gained by watching the front view of the race to see how much any bumping or squeezing affected the runners.
I usually start with the race chart and see which horses were taking money. If the lowest odds horses finish in the money, I’ll assume the race was run pretty much according to form; if longshots come in, I’ll assume the result was affected by the pace, and will look for any horse that suffered running “against the grain” of the race.
These are the general categories of horses either to watch or to avoid next race out.
• Horses that ran too fast on a hot pace and had trouble hanging on before the wire came up.
• Horses that ran behind on a slow pace and left too much work to do and not enough ground to do it in.
• Front running horses that got bumped or squeezed at the break and didn’t get a chance to run their usual race.
• Late runners that got boxed in on the rail, or that were forced to weave their way through traffic or to run noticeably wide throughout.
• Horses that got an easy lead at slow fractions and never felt a real challenge.
(I will bolden the examples that seem to have a shot to run in the Kentucky Derby.)
If front-running favorites fill out the trifecta, and a closer is able to make up ground to finish, say, 4th, he gets extra credit. (Although some of these will not have the graded earnings to make the Derby, following are some examples: Dullahan; Prospective; Jake Mo; Adirondack King; Optimizer; Daddy Nose Best; Rousing Sermon; and Paynter in the Santa Anita Derby.)
It the pace is hot, and a runner is still hanging on when the other frontrunners have cracked, he should get extra credit for that, even if he doesn’t win—even if he finishes 5th or 6th. He should get even more credit if he is actually able to hold on and win. (Examples: Hansen in the Gotham; The Lumber Guy and Gemologist in the Wood; Our Entourage in the Illinois Derby; Castaway and Ender Kneivel in the Sunland Derby, and Bodemeister in the San Felipe. (Handsome Mike is an example of a horse that has suffered both ways: He ran too fast early in the El Camino Real in February, then was taken back, which left him too much to do in the Spiral on March 24. Duuhhh… Sorry, Mike. Bad luck. But you’re worth a look next time you do run.)
Some names who seemed to have things their own way, and whose performances seem overrated, include I’ll Have Another; Trinniberg, Take Charge Indy and Reveron in the Florida Derby. El Padrino’s win in the Risen Star was exposed in the Florida Derby, and Hero of Order and Mark Valeski‘s performances were weaker than looked in both the Risen Star and the Louisiana Derby.
One variable that is almost impossible to detect from Derby preps is how the runner will handle the distance. However counter-instinctive, there is no guarantee that a late running closer at a shorter distance will like a mile and a quarter. Still, apart from a crystal ball, watching video replays of past races offers a pretty good view into the future.